import matplotlib.pyplot as plt
import pyproj
from shapely import Point, Polygon
from shapely.ops import transform


plt.rcParams["figure.facecolor"] = (1, 1, 1, 0)  # RGBA tuple with alpha=0
plt.rcParams["axes.facecolor"] = (1, 1, 1, 0) # RGBA tuple with alpha=0Shapely
pol1 = Polygon([[0, 0], [1, 0], [1, 1], [0, 1], [0, 0]])

print(pol1.area)
print(pol1.length)
print(pol1.bounds)
print(pol1.centroid)
print(pol1.representative_point())
print(pol1.exterior)
print(pol1.exterior.xy)


fig, ax = plt.subplots(figsize=(4, 4))
ax.plot(*pol1.exterior.xy)
ax.plot(*pol1.centroid.xy, "o")
# ax.set_aspect('equal')
plt.show()
1.0
4.0
(0.0, 0.0, 1.0, 1.0)
POINT (0.5 0.5)
POINT (0.5 0.5)
LINEARRING (0 0, 1 0, 1 1, 0 1, 0 0)
(array('d', [0.0, 1.0, 1.0, 0.0, 0.0]), array('d', [0.0, 0.0, 1.0, 1.0, 0.0]))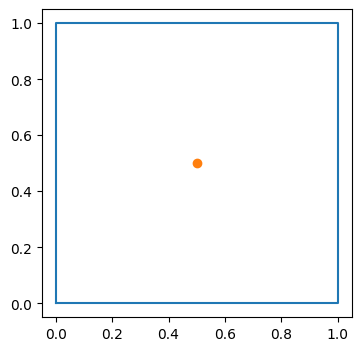
def set_limits(ax, x0, xN, y0, yN):
    ax.set_xlim(x0, xN)
    ax.set_xticks(range(x0, xN + 1))
    ax.set_ylim(y0, yN)
    ax.set_yticks(range(y0, yN + 1))
    ax.set_aspect("equal")
from shapely.plotting import plot_polygon, plot_pointsplot_polygon??Signature:
plot_polygon(
polygon,
ax=None,
add_points=True,
color=None,
facecolor=None,
edgecolor=None,
linewidth=None,
**kwargs,
)
Source:
def plot_polygon(
polygon,
ax=None,
add_points=True,
color=None,
facecolor=None,
edgecolor=None,
linewidth=None,
**kwargs
):
"""
Plot a (Multi)Polygon.
Note: this function is experimental, and mainly targetting (interactive)
exploration, debugging and illustration purposes.
Parameters
----------
polygon : shapely.Polygon or shapely.MultiPolygon
ax : matplotlib Axes, default None
The axes on which to draw the plot. If not specified, will get the
current active axes or create a new figure.
add_points : bool, default True
If True, also plot the coordinates (vertices) as points.
color : matplotlib color specification
Color for both the polygon fill (face) and boundary (edge). By default,
the fill is using an alpha of 0.3. You can specify `facecolor` and
`edgecolor` separately for greater control.
facecolor : matplotlib color specification
Color for the polygon fill.
edgecolor : matplotlib color specification
Color for the polygon boundary.
linewidth : float
The line width for the polygon boundary.
**kwargs
Additional keyword arguments passed to the matplotlib Patch.
Returns
-------
Matplotlib artist (PathPatch), if `add_points` is false.
A tuple of Matplotlib artists (PathPatch, Line2D), if `add_points` is true.
"""
from matplotlib import colors
if ax is None:
ax = _default_ax()
if color is None:
color = "C0"
color = colors.to_rgba(color)
if facecolor is None:
facecolor = list(color)
facecolor[-1] = 0.3
facecolor = tuple(facecolor)
if edgecolor is None:
edgecolor = color
patch = patch_from_polygon(
polygon, facecolor=facecolor, edgecolor=edgecolor, linewidth=linewidth, **kwargs
)
ax.add_patch(patch)
ax.autoscale_view()
if add_points:
line = plot_points(polygon, ax=ax, color=color)
return patch, line
return patch
File: ~/.pyenv/versions/3.11.1/envs/py3111/lib/python3.11/site-packages/shapely/plotting.py
Type: functionimport matplotlib.pyplot as plt
from matplotlib.patches import PathPatch
from matplotlib.path import Path
from shapely.geometry import Polygon
import numpy as np
def plot_shapely_polygon(polygon, ax=None, **kwargs):
if isinstance(polygon, Polygon):
polygons = [polygon]
else:
polygons = list(polygon.geoms)
for polygon in polygons:
exterior_coords = np.array(polygon.exterior.coords)
interior_coords = [np.array(ring.coords) for ring in polygon.interiors]
codes = [Path.MOVETO]
codes.extend([Path.LINETO] * (len(exterior_coords) - 2))
codes.append(Path.CLOSEPOLY)
for ring in interior_coords:
codes.append(Path.MOVETO)
codes.extend([Path.LINETO] * (len(ring) - 2))
codes.append(Path.CLOSEPOLY)
all_coords = np.vstack([exterior_coords] + interior_coords)
path = Path(all_coords, codes)
patch = PathPatch(path, **kwargs)
ax.add_patch(patch)fig, axes = plt.subplots(1, 4, figsize=(4, 16), dpi=90)
ext = [(0, 0), (0, 2), (2, 2), (2, 0), (0, 0)]
int = [(1, 0), (0.5, 0.5), (1, 1), (1.5, 0.5), (1, 0)][::-1]
polygon = Polygon(ext, [int])
plot_polygon(polygon, ax=axes[0], add_points=False)
# plot_points(polygon, ax=axes[0], alpha=0.7)
axes[0].set_title("a) valid")
set_limits(axes[0], -1, 3, -1, 3)
ext = [(0, 0), (0, 2), (2, 2), (2, 0), (0, 0)]
int = [(1, 0), (0, 1), (0.5, 1.5), (1.5, 0.5), (1, 0)][::-1]
polygon = Polygon(ext, [int])
plot_polygon(polygon, ax=axes[1], add_points=False)
plot_points(polygon, ax=axes[1], alpha=0.7)
axes[1].set_title("b) invalid")
set_limits(axes[1], -1, 3, -1, 3)
x, y = polygon.exterior.xy
axes[2].fill(x, y, alpha=0.5, fc="r")
axes[2].plot(x, y, marker="o", color="r")
for interior in polygon.interiors:
x, y = interior.xy
axes[2].fill(x, y, alpha=0, fc=(1, 1, 1, 0)) # fill with white to create a hole effect
axes[2].plot(x, y, marker="o", color="r")
# Customize plot
axes[2].set_title("Shapely Polygon")
set_limits(axes[2], -1, 3, -1, 3)
exterior_coords = np.array(polygon.exterior.coords)
interior_coords = [np.array(ring.coords) for ring in polygon.interiors]
codes = [Path.MOVETO]
codes.extend([Path.LINETO] * (len(exterior_coords) - 2))
codes.append(Path.CLOSEPOLY)
for ring in interior_coords:
codes.append(Path.MOVETO)
codes.extend([Path.LINETO] * (len(ring) - 2))
codes.append(Path.CLOSEPOLY)
all_coords = np.vstack([exterior_coords] + interior_coords)
path = Path(all_coords, codes)
patch = PathPatch(path, facecolor="r", edgecolor="r", alpha=0.5)
axes[3].add_patch(patch)
axes[3].plot(x, y, marker="o", color="r")
axes[3].set_title("Matplotlib PathPatch")
set_limits(axes[3], -1, 3, -1, 3)
plt.show()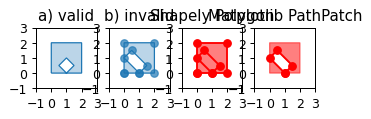
all_coordsarray([[0. , 0. ],
[0. , 2. ],
[2. , 2. ],
[2. , 0. ],
[0. , 0. ],
[1. , 0. ],
[1.5, 0.5],
[0.5, 1.5],
[0. , 1. ],
[1. , 0. ]])Transforms
wgs84_pt = Point(-72.2495, 43.886)

wgs84 = pyproj.CRS("EPSG:4326")
utm = pyproj.CRS("EPSG:32618")

project = pyproj.Transformer.from_crs(wgs84, utm, always_xy=True).transform
utm_point = transform(project, wgs84_pt)

utm_point.xy
(array('d', [720944.1103566973]), array('d', [4862889.031679545]))